Debugging Suspense with the React Suspense Panel
The Suspense panel in React Developer Tools shows which boundary suspended, what it was waiting for, and the order your page revealed its content.

Aurora Scharff
October 1, 2026
The Suspense panel in React Developer Tools shows the <Suspense> boundaries on a page, what they waited for, and the order they revealed their content in. When a fallback stays on screen longer than expected or content moves as it loads, the panel helps us find the boundary behind it.
In this post, I'll use it to debug a dashboard whose sales stats take about two seconds to appear and whose quick actions move when the cards arrive. Along the way, we'll cover where to find the panel and the parts we need.
The Dashboard Problem
Let's say we have a simplified store dashboard. It shows a summary line with the store's name and plan, four sales stats underneath, and a quick actions section at the bottom. The summary and the stats load separately, and the stats sit in a nested boundary so the summary can show first:
// Dashboard.jsx
import { Suspense, use } from 'react';
import { getStore, getSalesStats } from './data.js';

export default function Dashboard() {
  return (
    <main>
      <h1>Dashboard</h1>
      <Suspense fallback={<DashboardSkeleton />}>
        <StoreSummary />
        <Suspense fallback={<StatsSkeleton />}>
          <SalesStats />
        </Suspense>
      </Suspense>
      <QuickActions />
    </main>
  );
}

function StoreSummary() {
  const store = use(getStore());
  return <p className="store">{store.name} · {store.plan} plan</p>;
}

function SalesStats() {
  const stats = use(getSalesStats());
  return (
    <div className="stats">
      {stats.map((stat) => (
        <div key={stat.label} className="stat">
          <span className="stat-label">{stat.label}</span>
          <span className="stat-value">{stat.value}</span>
          <span className="stat-change">{stat.change} from last week</span>
        </div>
      ))}
    </div>
  );
}
The getStore() and getSalesStats() functions query the database. They return cached Promises, the way a Suspense-enabled data library would, so use() reads the same Promise on every render. While the outer boundary waits, DashboardSkeleton shows a placeholder line for the summary above the same StatsSkeleton.
The page works, but the stats take about two seconds to appear. While we wait, the dashboard shows a plain gray block where the four cards will go. When the cards arrive, they push the quick actions down. Let's use the panel to work through both problems.
Opening the Suspense Panel
The Suspense tab is enabled by default in React Developer Tools 8.0. After installing or updating the extension, we can open the dashboard, open the browser developer tools, and select the Suspense tab. The screenshots in this post use Chrome:
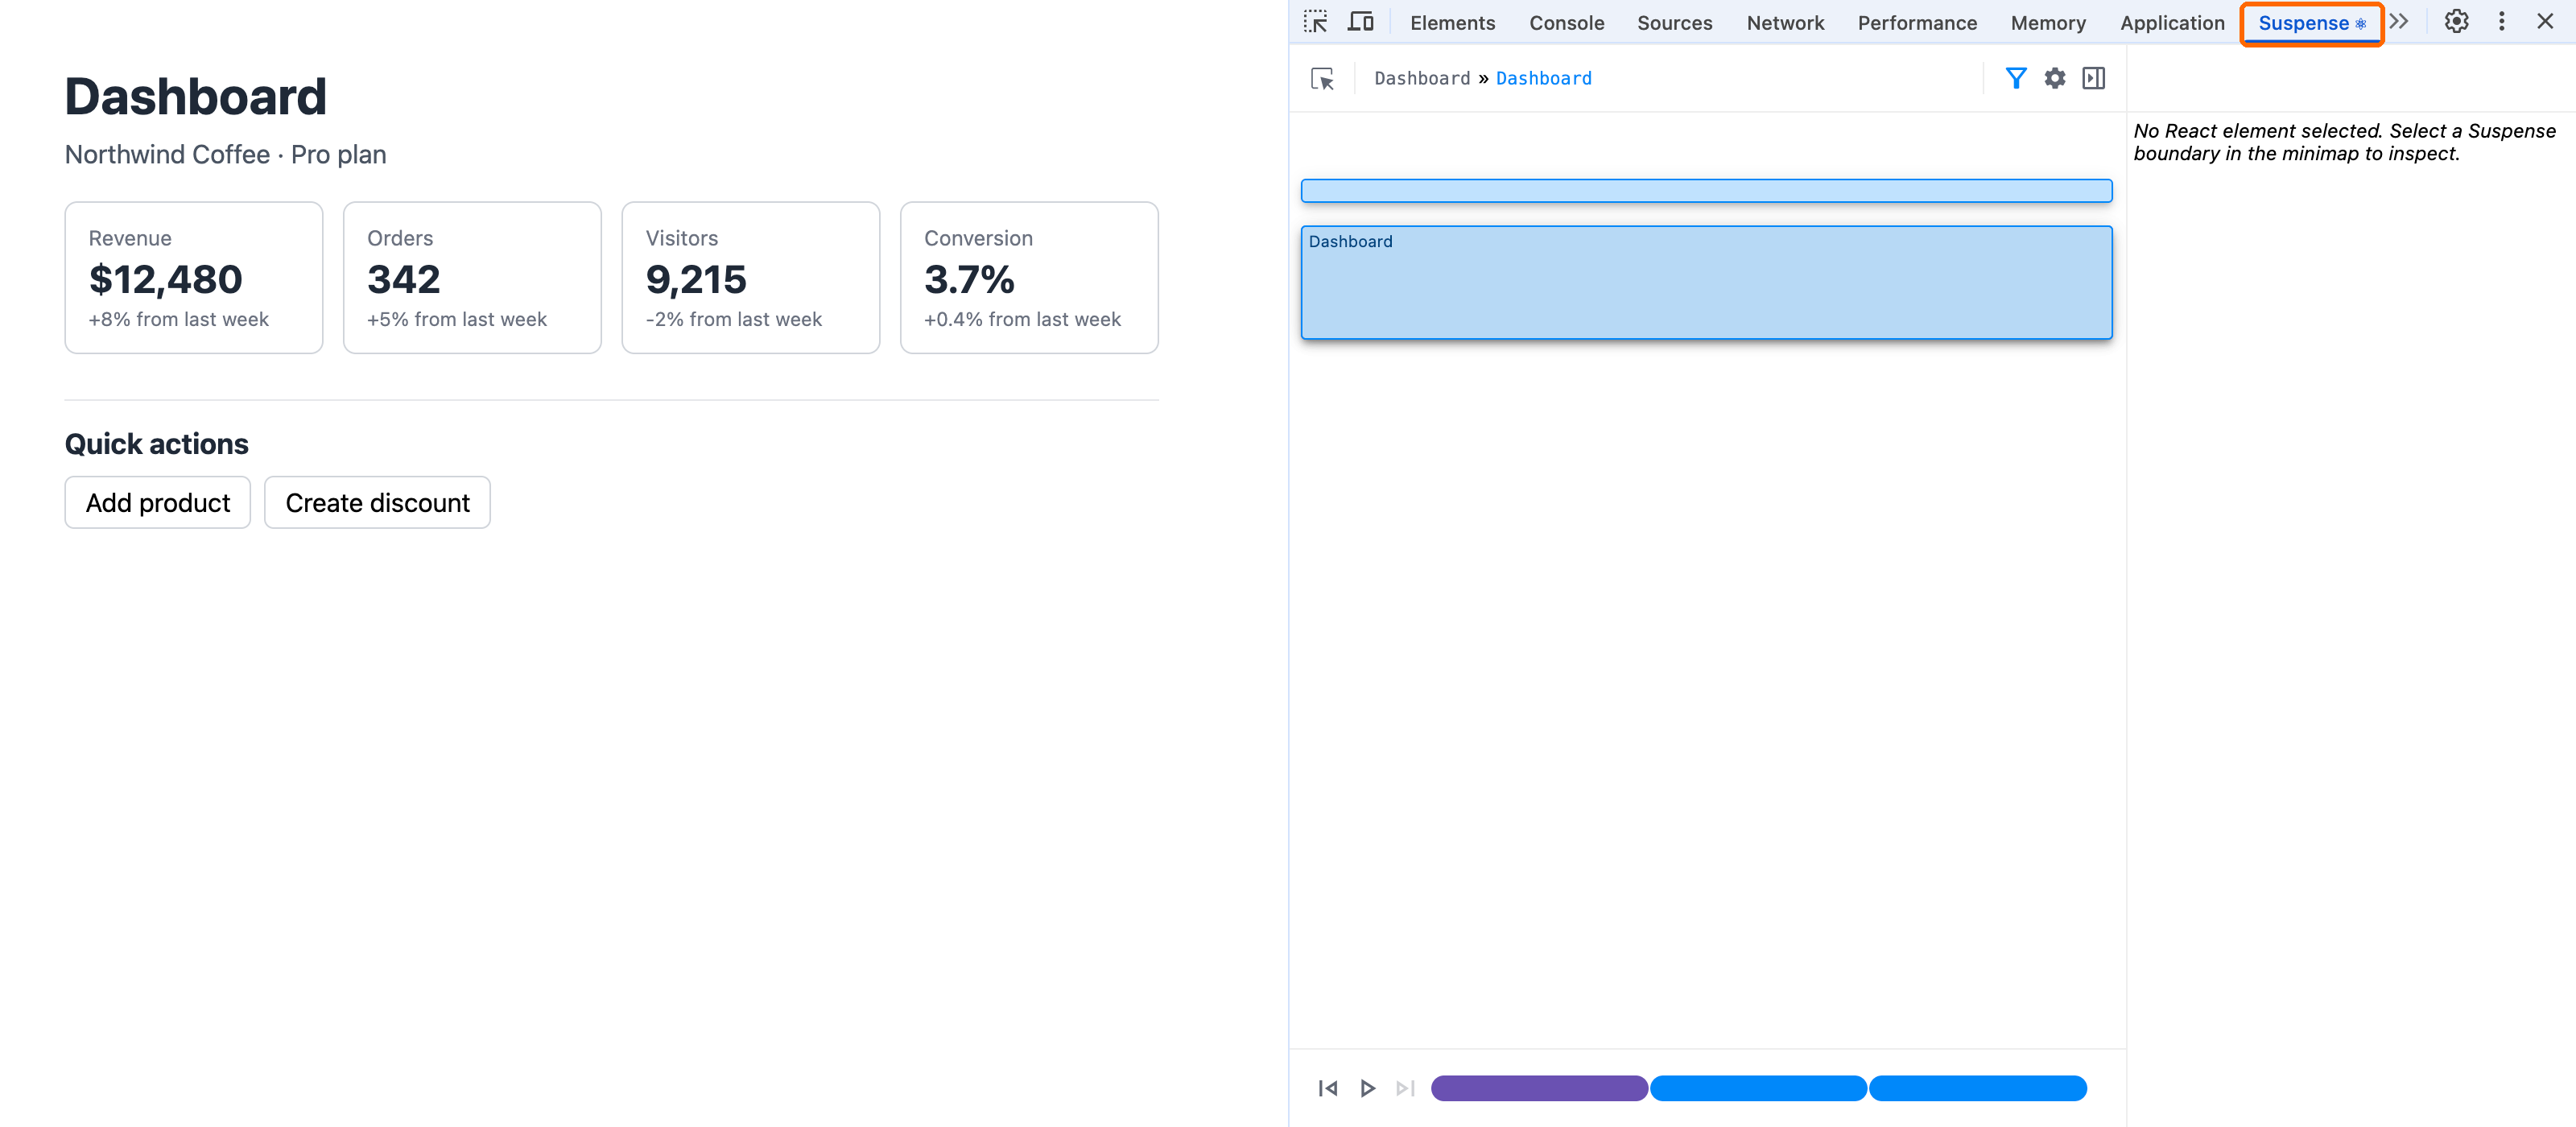
The panel works with older React versions and production builds, but it shows the most detail with a development build of React 19.2 or later. If the tab doesn't show up, reload the page with the developer tools open, and check that Hide Suspense tab is turned off in the React Developer Tools settings.
Once it's open, the panel has four areas:
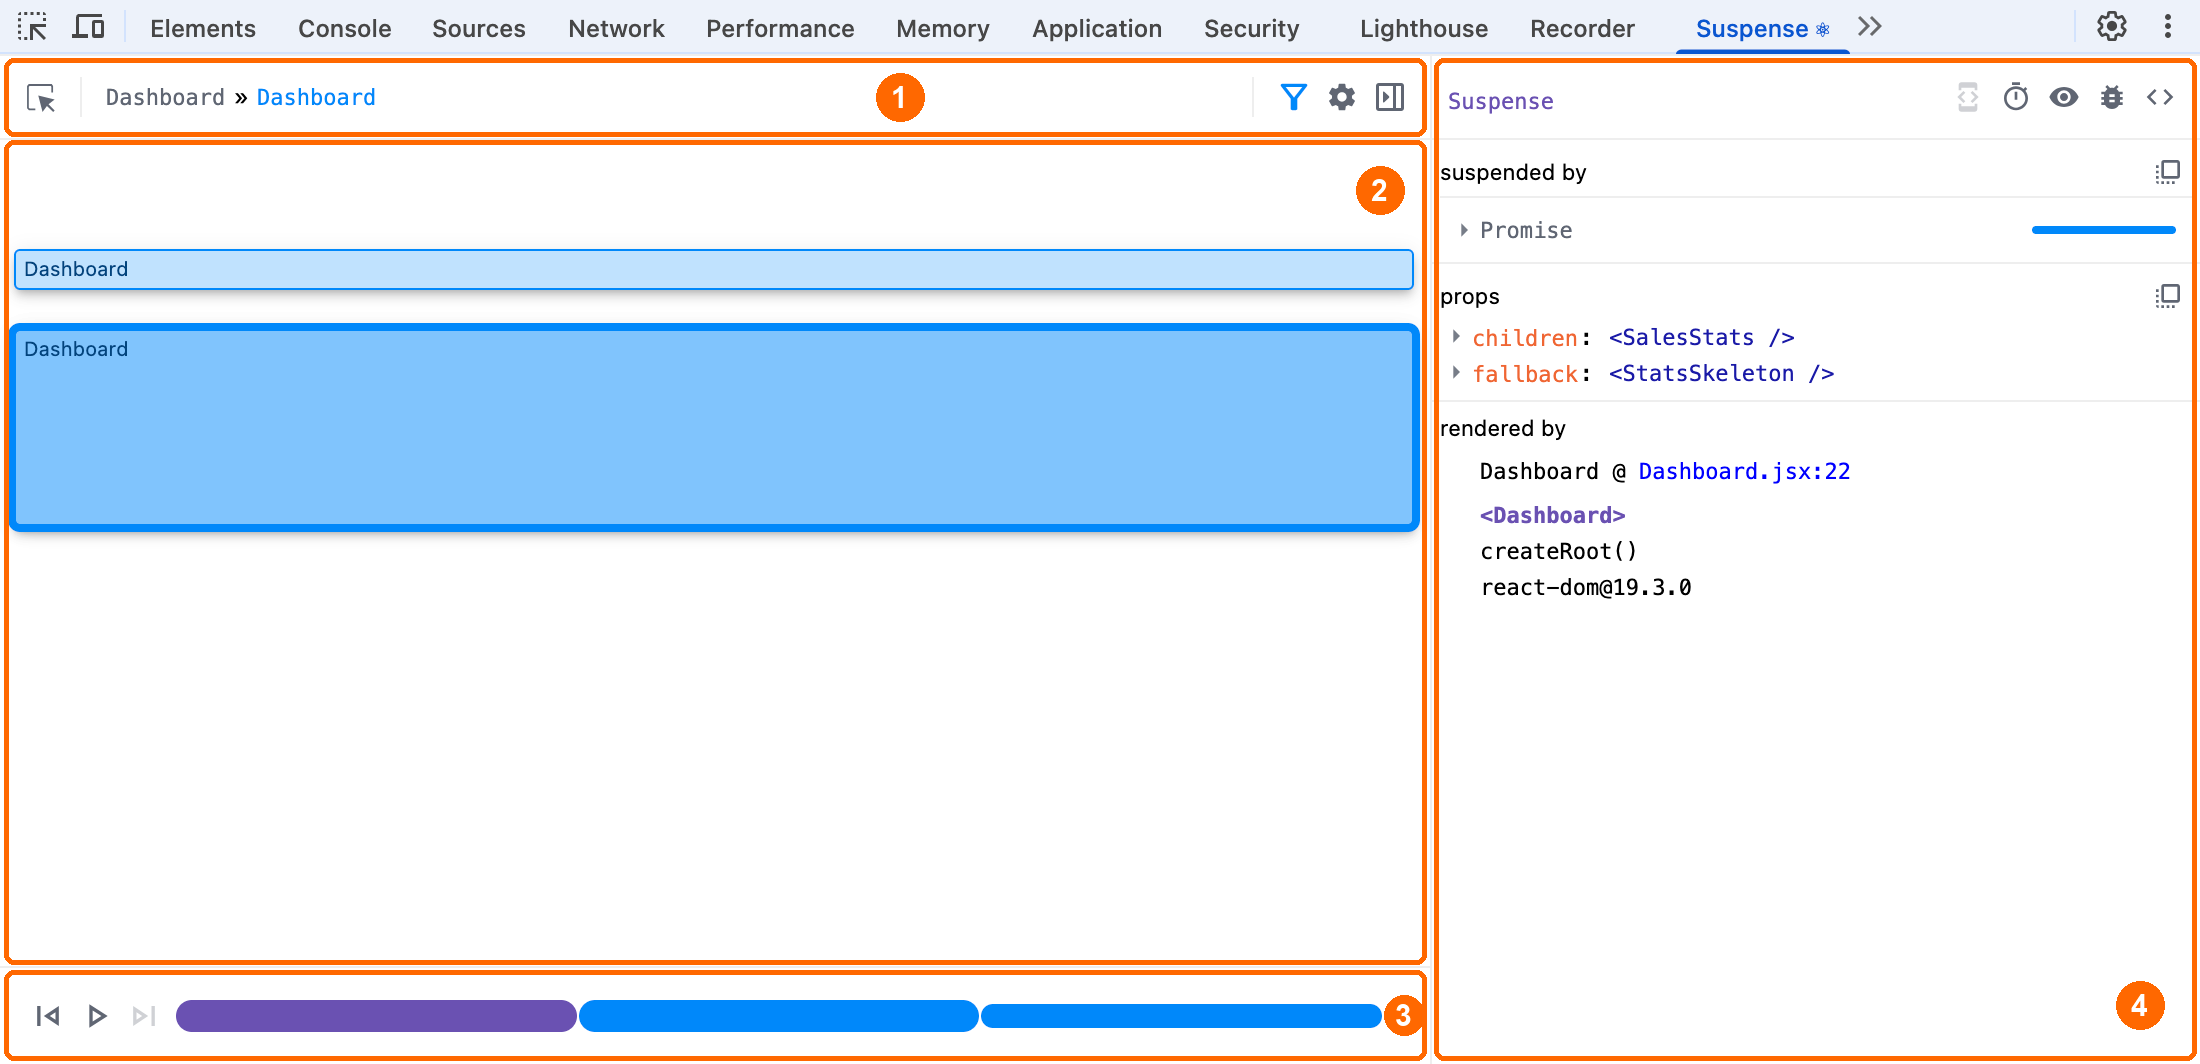
- Toolbar. The Inspect Suspense Nodes button lets us pick a boundary by clicking content on the page. The breadcrumbs move through nested boundaries, and the filter button controls which boundaries the minimap shows.
- Minimap. A map of the page's Suspense boundaries. Each outlined region is the content inside a boundary, drawn where it sits on the page. Its color indicates whether the content rendered on the client, the server, or another environment. Hovering a region highlights that content on the page, and selecting it opens the boundary in the inspector.
- Timeline. A step for the initial paint, plus a step whenever a boundary reveals its content. Selecting a step puts the page back in the state it was in at that point.
- Inspector. Details about the selected boundary, including what it was suspended by, its
childrenandfallbackprops, and the component that rendered it. The buttons at the top include one that forces the boundary back to its fallback.
Now we can return to the dashboard and use the timeline to find the layout shift.
Replaying the Reveal to Find a Layout Shift
The jump happens too fast to follow on a normal reload, so we can step through the timeline instead. Selecting a step, or pressing Play, updates the page to show what was visible at that point:

The first two steps line up, with the summary text replacing its placeholder line in place. At the third step, the gray block gives way to the stat cards, which are taller and push the quick actions down. The shift happens when the stats boundary reveals its content. Seeing the steps next to each other also shows how little the gray block has in common with the cards that replace it.
The quick actions can move even though the boundaries are nested, because QuickActions renders outside both of them. It's on screen from the first paint, so it moves whenever the content above it changes height. Nesting the stats boundary controls the order the sections reveal in, but it doesn't reserve their space.
The spacing between steps reflects their order, not elapsed time, so the timeline can't tell us how long the stats took. It also doesn't tell us which boundary in the code is responsible.
Finding the Boundary Behind the Shift
On a small page, we could find the stats boundary by selecting regions in the minimap. On a page with many boundaries, it's quicker to start from the content itself. Let's click Inspect Suspense Nodes in the toolbar and hover the stat cards:
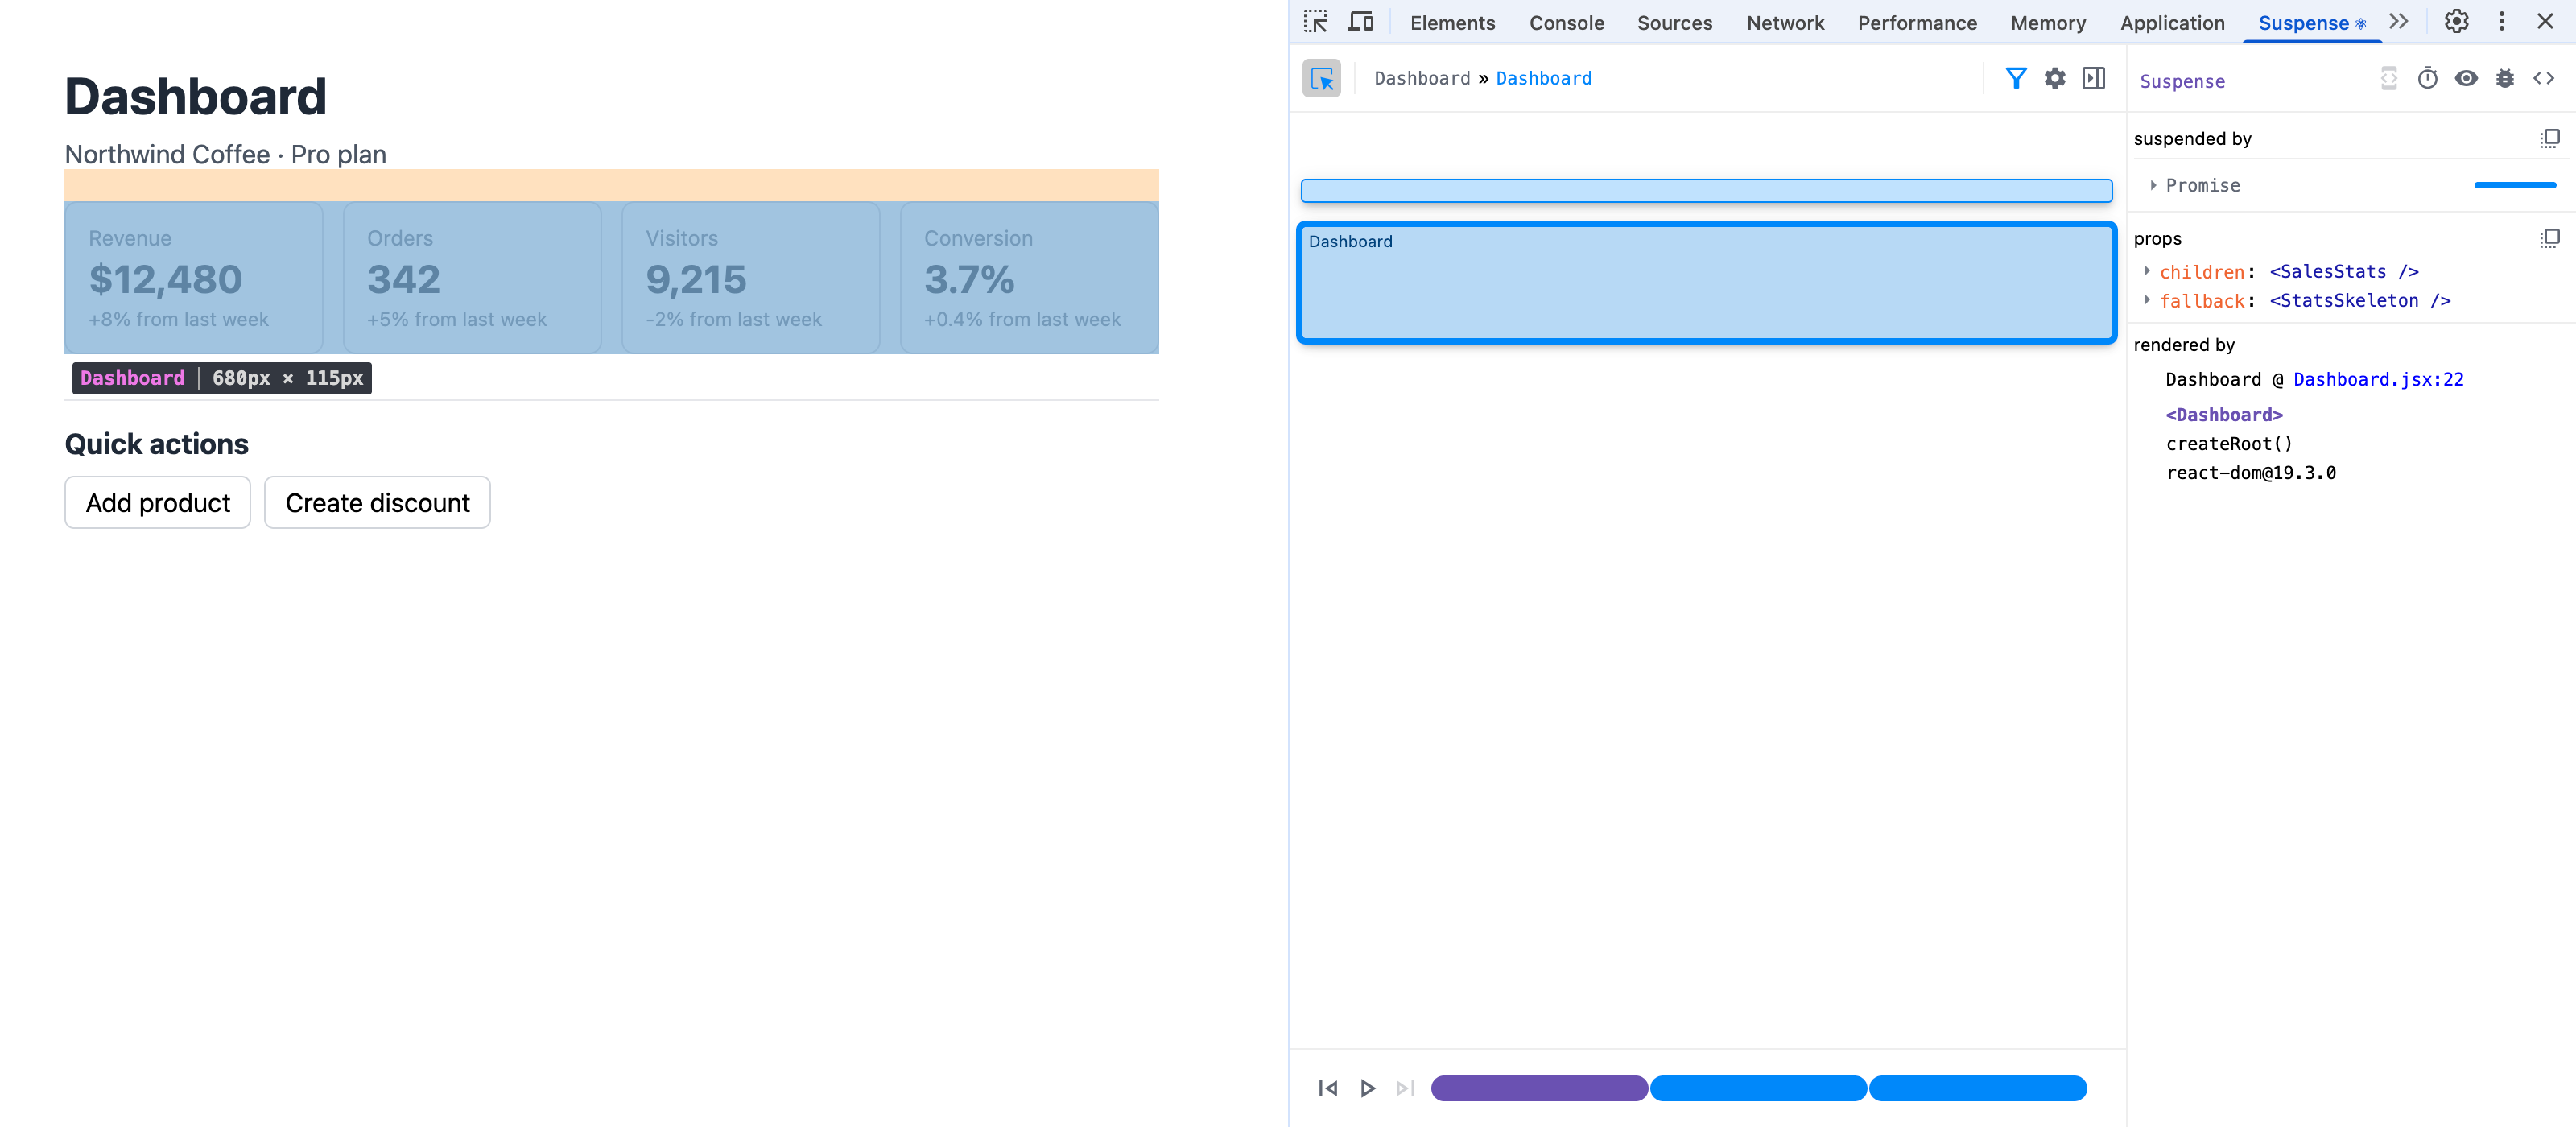
The page highlights the content of the nearest boundary, and clicking selects it in the panel. The inspector confirms it's the boundary that renders <SalesStats />, with <StatsSkeleton /> as its fallback.
By default, the minimap hides boundaries that never suspended or that suspended on the same data as their parent. If a boundary you're looking for isn't there, turning off the Unique Suspenders filter shows all of them.
Finding What the Stats Are Waiting For
With the stats boundary selected, we can also look at the second problem. The Suspended by section lists the work that kept the boundary on its fallback. Hovering the time bar shows how long it took, and expanding the entry shows where it was awaited and what it resolved to:
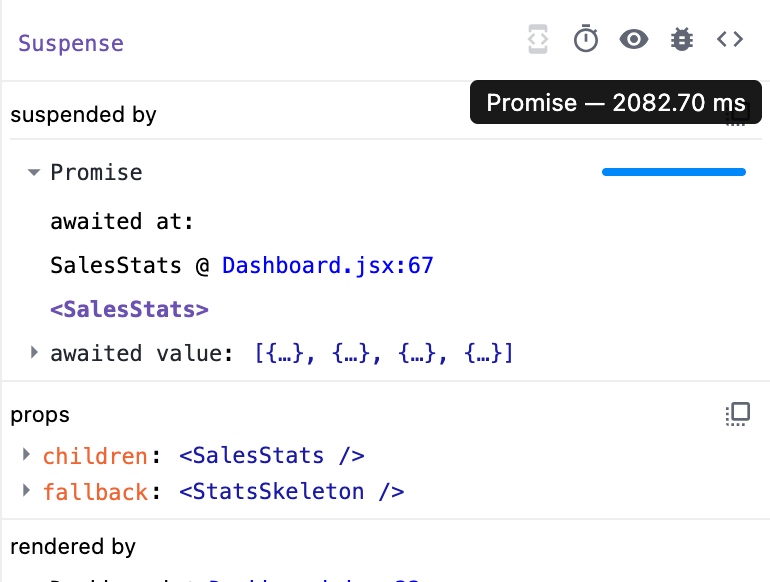
There's a single cause here, the Promise that SalesStats reads with use(), and the boundary spent about two seconds waiting for it. The awaited value is the four stats, so we've narrowed the delay to the data path behind getSalesStats() rather than the boundary reveal.
The inspector doesn't tell us why the Promise took two seconds. The time could come from the database query, a network request, or another delay inside getSalesStats(). In this walkthrough, we'll leave that data path alone and use the panel to fix the loading experience around it.
For other pages, Suspended by can also list components loaded with lazy() and resources like stylesheets, fonts, and images. If it says a Promise was thrown, it can't show what suspended. That happens with libraries that throw Promises directly instead of using use().
Fixing the Skeleton
Now that we've traced the wait to getSalesStats(), we can go back to the jump. The stats boundary's fallback is the part that changes size and looks out of place, so let's compare it against the cards it stands in for. We don't need to slow down the network or add a temporary delay for that. With the stats boundary selected, the stopwatch button in the inspector (Suspend the selected component) puts the fallback back on the page until we click it again:
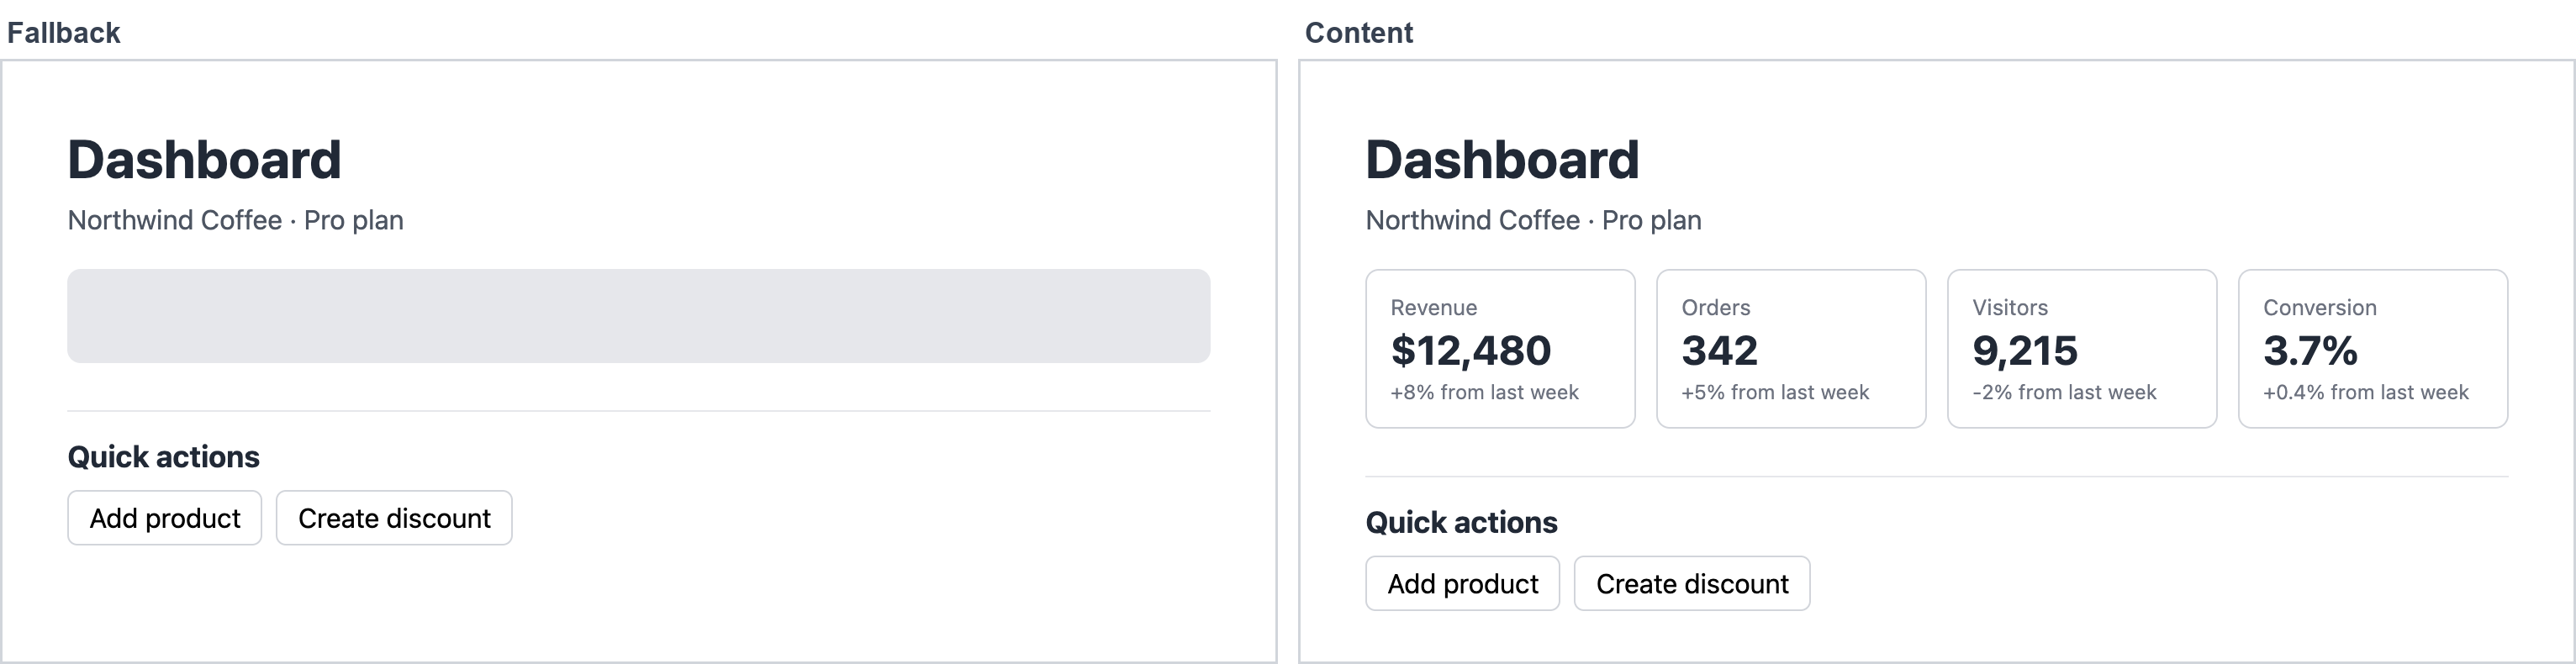
Side by side, the fallback misses on both shape and size. The skeleton is a single gray block with a fixed height of its own:
// Dashboard.jsx
function StatsSkeleton() {
  return <div className="stats-skeleton" />;
}
Nothing about this block suggests four stats are on the way, and since the cards have a label, a large value, and a line for the weekly change, they end up taller than it. The dashboard always shows the same four stats, so we can render the four real cards with their real labels, and use placeholder lines only for the values that come from the query:
// Dashboard.jsx
function StatsSkeleton() {
  return (
    <div className="stats">
      {['Revenue', 'Orders', 'Visitors', 'Conversion'].map((label) => (
        <div key={label} className="stat">
          <span className="stat-label">{label}</span>
          <span className="stat-value skeleton-line" />
          <span className="stat-change skeleton-line" />
        </div>
      ))}
    </div>
  );
}
The skeleton-line placeholders are one line of text tall (height: 1lh), so they take up the same space as the value and the change they stand in for. Forcing the fallback again confirms the skeleton now has the shape and the size of the cards:
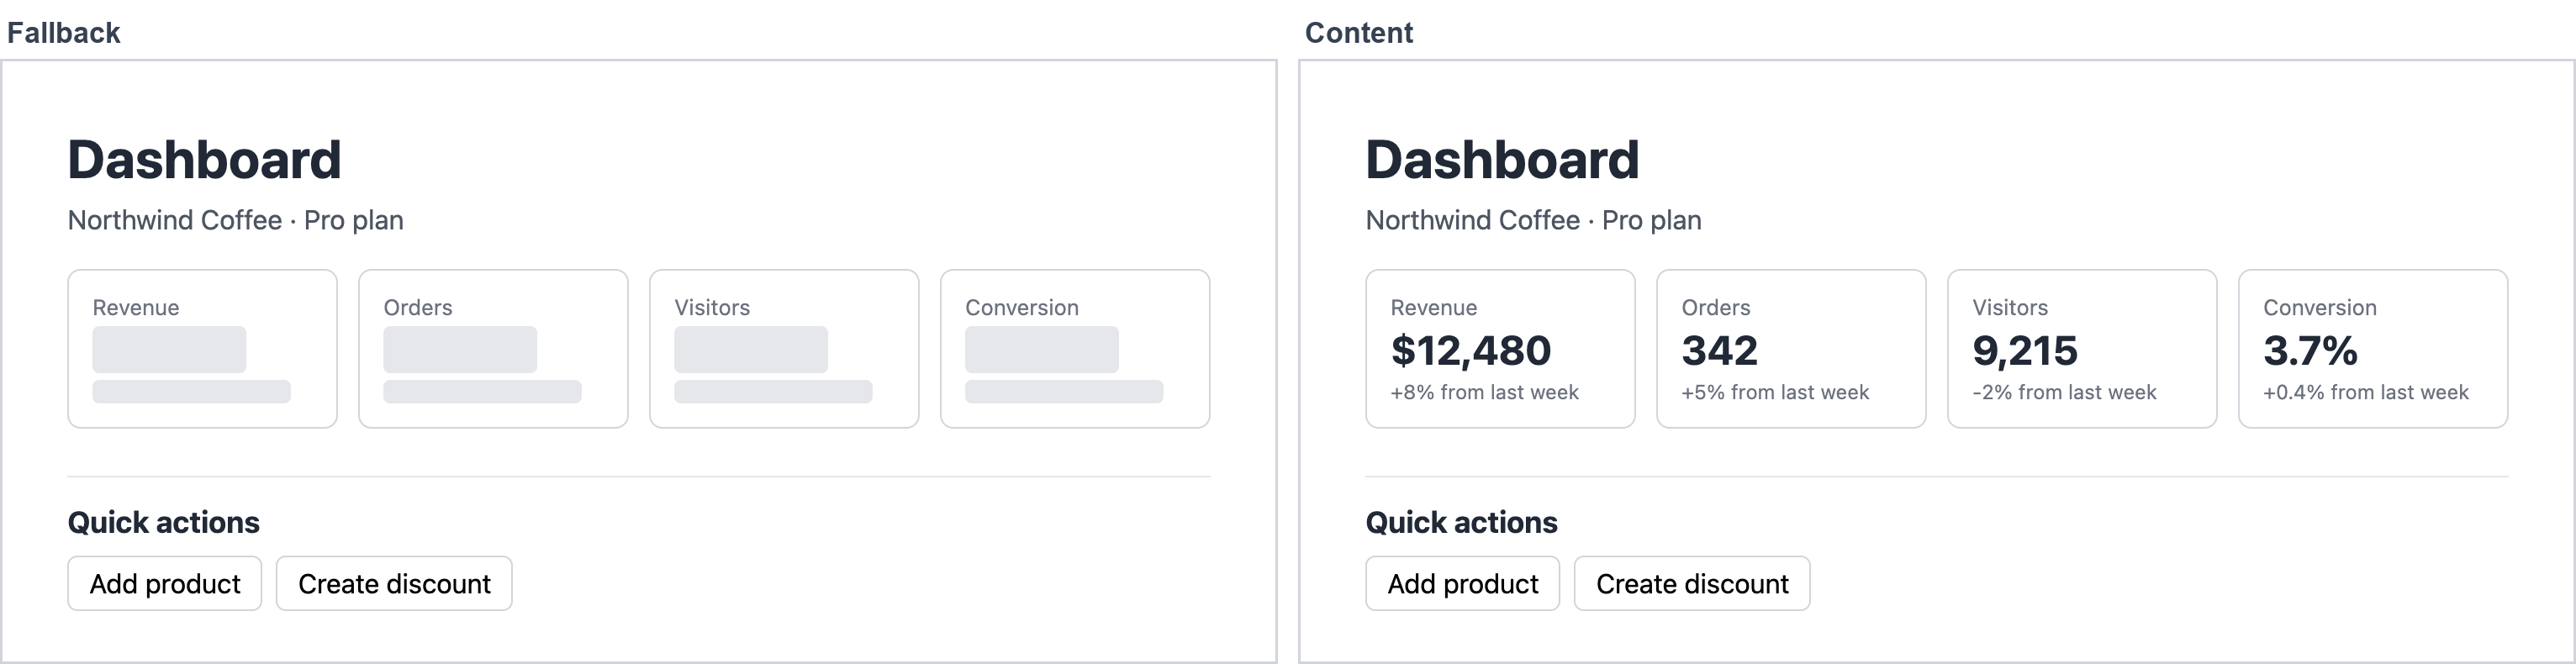
Replaying the timeline shows the quick actions staying in place through all three steps.
Key Takeaways
- The timeline shows when content moves. Stepping through the reveals points at the boundary behind a layout shift.
- Inspect Suspense Nodes starts from the page when you don't know which boundary owns a piece of content.
- Suspended by shows what a boundary waited for. The time bar and awaited value narrow the investigation to data, code, or a resource, but they don't explain why that work was slow.
- Forcing a fallback compares a skeleton against the real content in place, without changing the code or the network.
- A skeleton should look like the content it stands in for. When the shape is known ahead of time, like a fixed set of stats, it can match the real layout down to the labels.
- A React 19.2+ development build gives the panel the most detail.
Conclusion
What I like about the Suspense panel is that it makes a loading sequence inspectable without changing the network or adding delays to the code. It can't explain why an async operation is slow, but it shows which boundary waited for it and lets us compare each fallback against the content it replaces.
I covered where to place boundaries and how to size skeletons in Designing Loading UI in React, and how Suspense fits together with transitions in React Concurrent Features: An Overview.
Sources:
More certificates.dev articles
Get the latest news and updates on developer certifications. Content is updated regularly, so please make sure to bookmark this page or sign up to get the latest content directly in your inbox.

Debugging Suspense with the React Suspense Panel
The Suspense panel in React Developer Tools shows which boundary suspended, what it was waiting for, and the order your page revealed its content.
Aurora Scharff
Oct 1, 2026
Building Reusable Validators in Angular Signal Forms
Learn how to create reusable custom validators with Angular Signal Forms, with practical examples for building flexible and maintainable form validation.
Alain Chautard
Sep 29, 2026

A Reference to Composable Patterns in Vue
A catalog of practical patterns for writing composables that are flexible, predictable, and easy to reuse.

Reza Baar
Sep 23, 2026